Sara Abdelazim

Selected projects in data analysis and data visualization
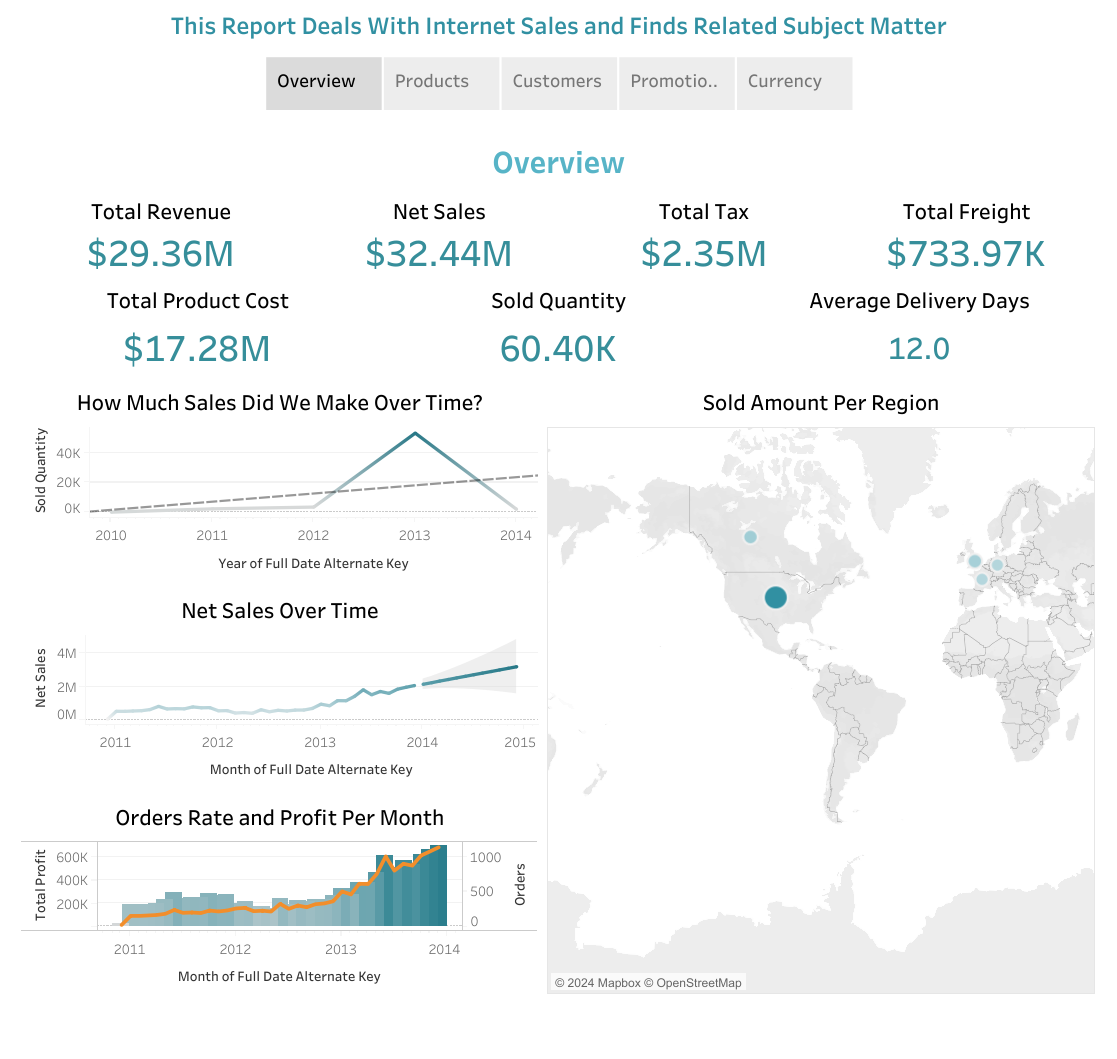
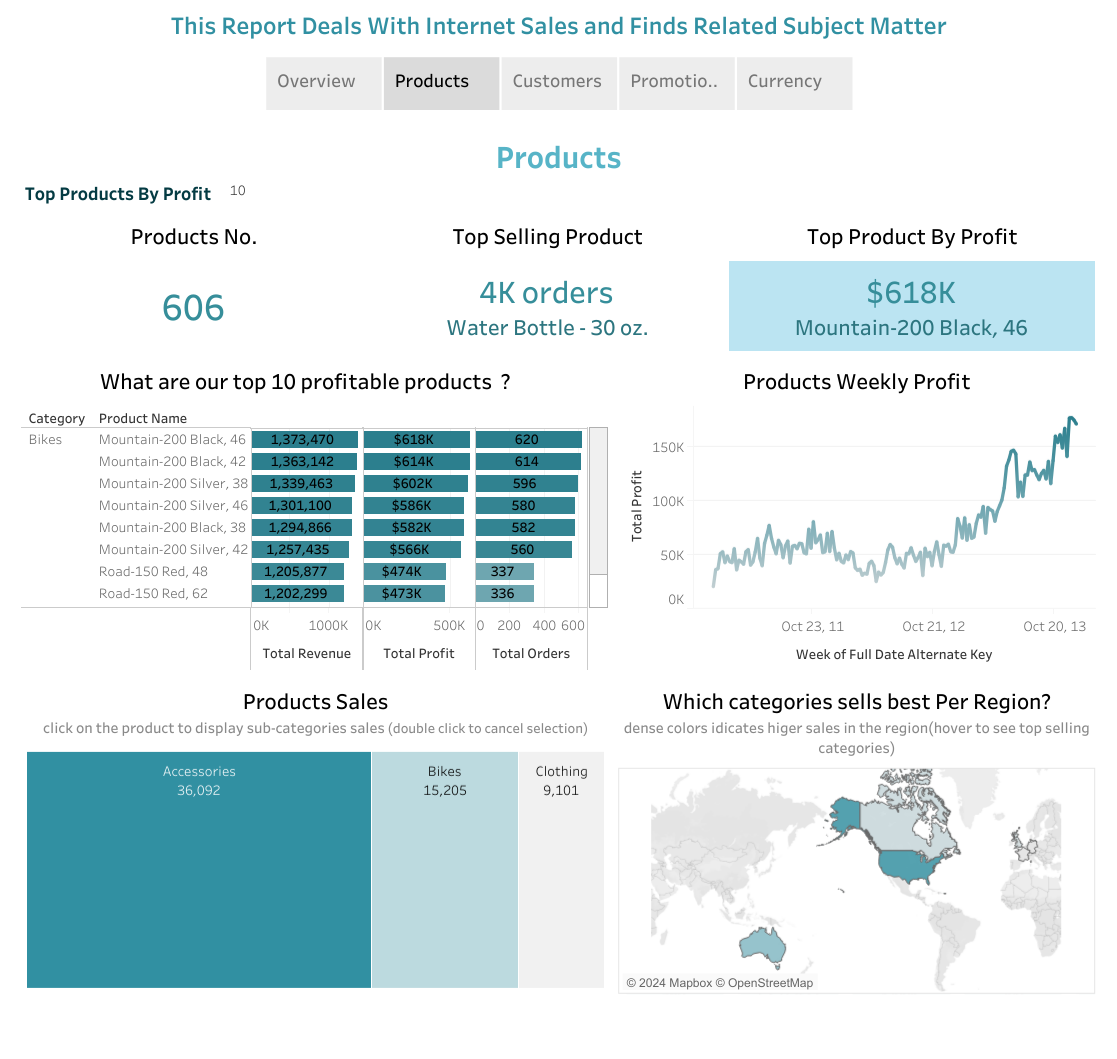
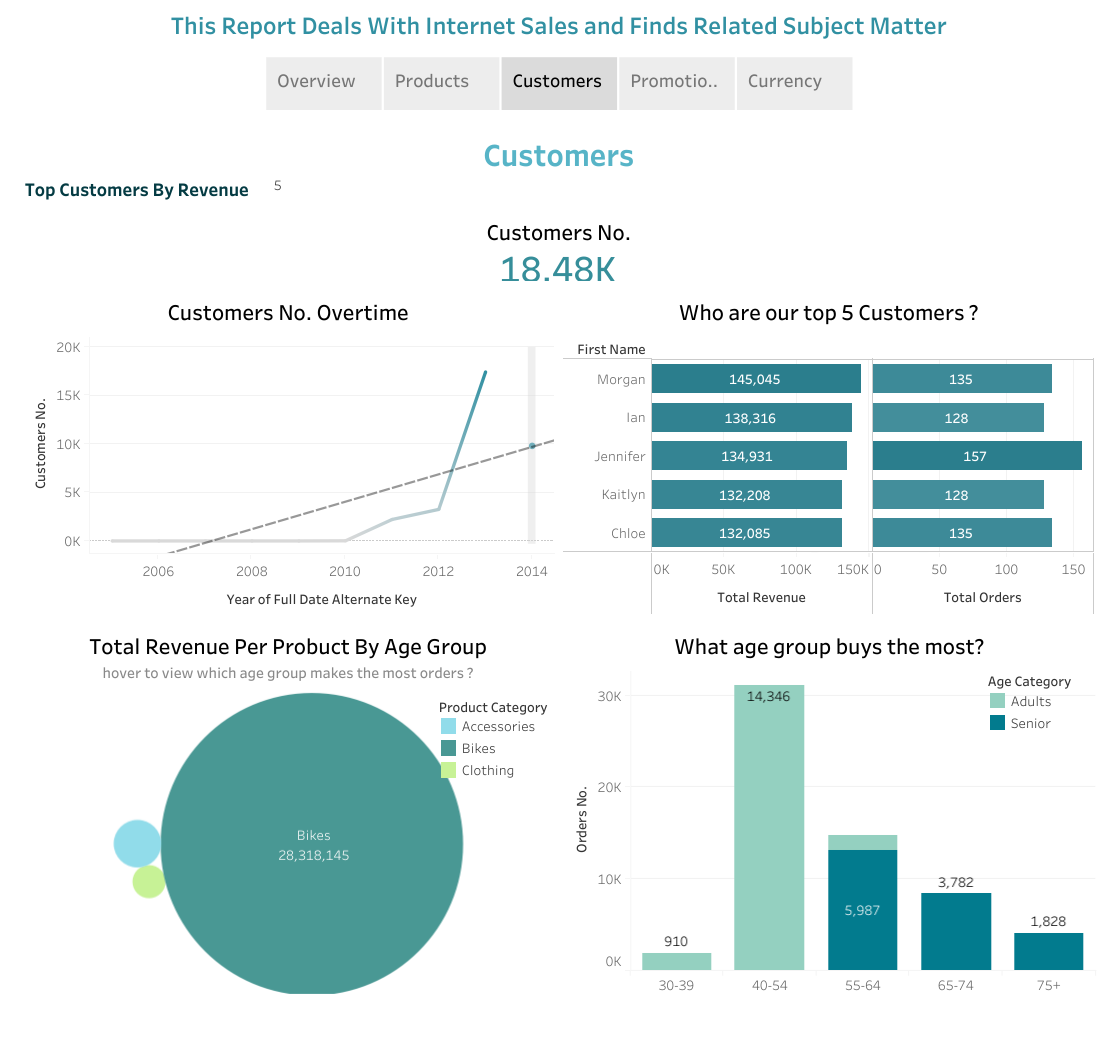
Analyzing Sales Trends and Patterns Using Tableau
I built a detailed Tableau dashboard with multiple tabs to analyze customer demographics, product profitability, and sales trends. This dashboard helps users understand key patterns and make informed decisions to drive revenue growth.
View dashboard on Tableau
View project on GitHub
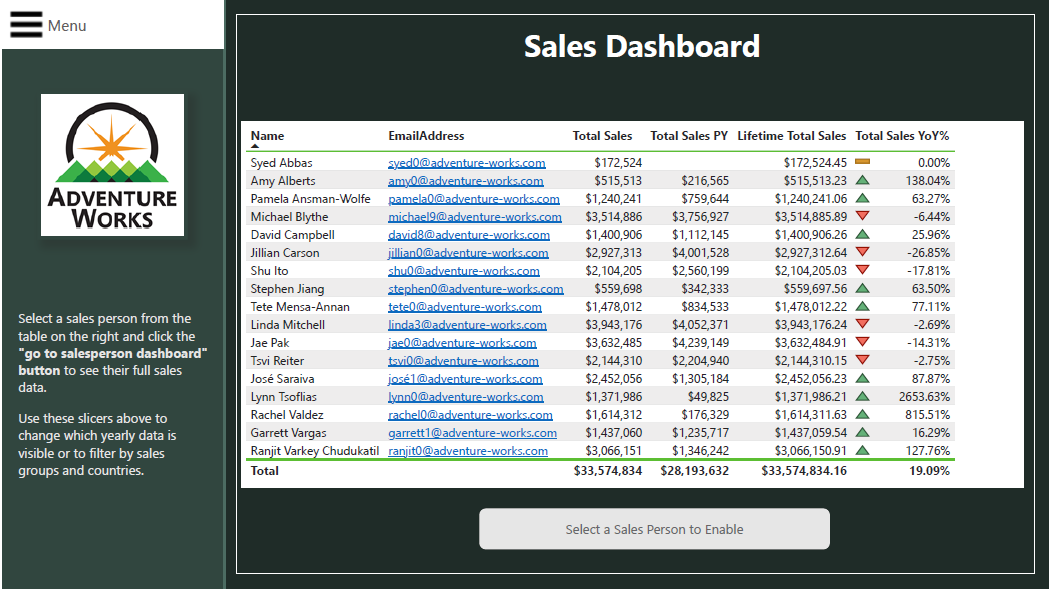
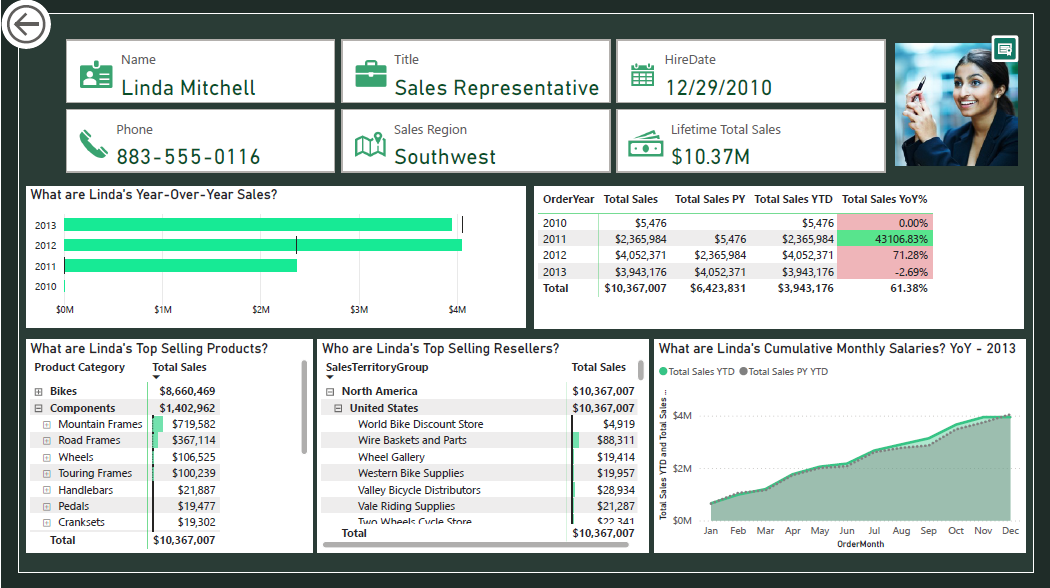
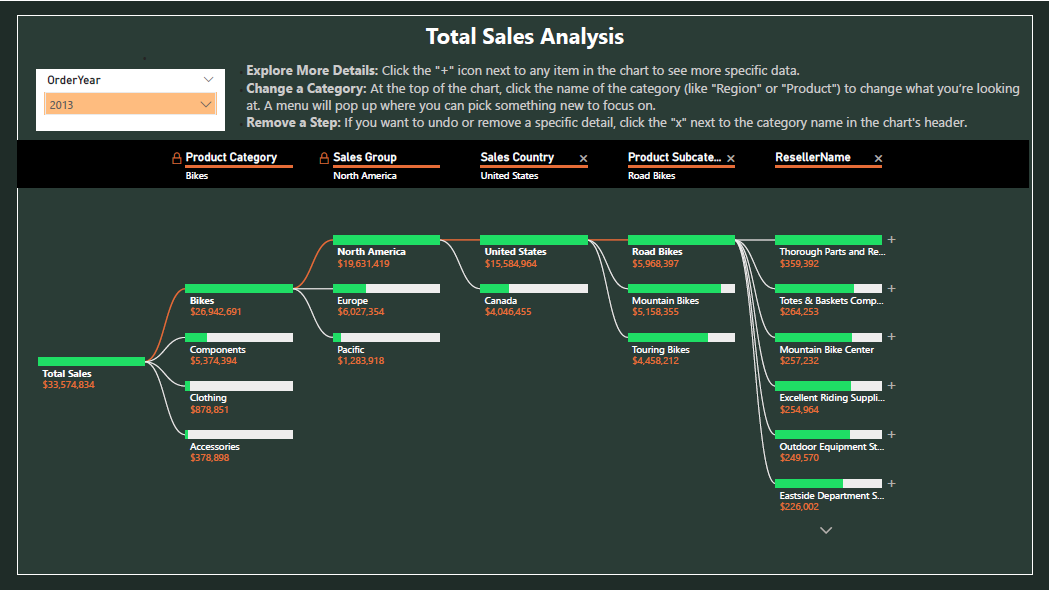
AdventureWorks Sales Insights: Power BI Analysis
The dashboard provides a clear view of key metrics, including reseller performance, employee sales figures, and product trends. It features real-time data updates and custom visuals to help users dive deeper into sales information. Key elements include a date filter for tracking different time periods, a drillthrough feature for detailed employee insights, and a panel for managing slicers. I also handled binary image data by converting it to Base64, making it easy to display pictures directly in the reports.
Streamlining ITI Data: SSIS ETL Integration
In this project, I worked on various SSIS exercises to manage ETL processes and integrate data from ITI. This included handling student records, course information, departmental details, and instructor profiles.
Sales Insights: Analyzing Data with Microsoft Analysis Services (SSAS)
In this lab, I worked with Multidimensional Expressions (MDX) queries to build and manage cubes and dimensions. This experience showcases my ability to extract accurate insights from sales data using MDX queries.
Exploring Bicycle Traffic Patterns: A Time Series Analysis of Seattle’s Fremont Bridge Counts
In this project, I analyzed bicycle traffic data from Seattle’s Fremont Bridge using Python. I examined time series data to identify trends across different intervals, including daily, weekly, monthly, and yearly.